
Teen Driver Safety – How Do Parental Views Differ by U.S. Region?
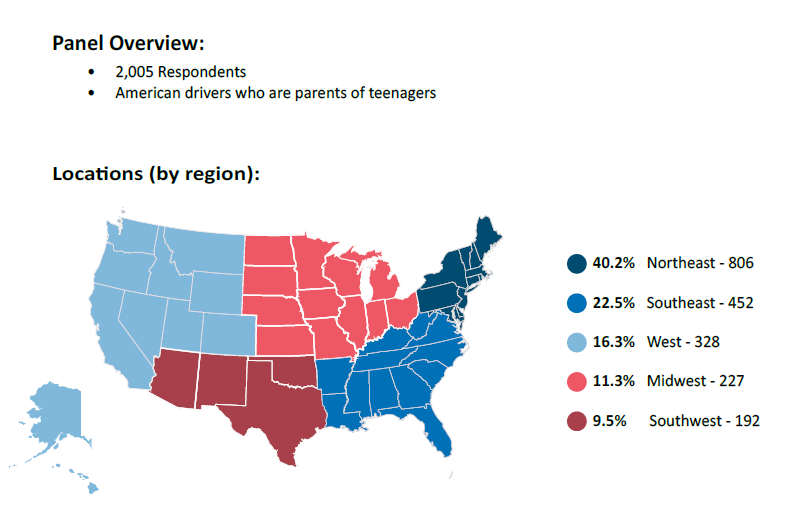
Last month, we explored the results of our Distracted Driving survey** from the perspective of parental gender. This blog provided some interesting insights regarding how male parents and female parents differ in terms of their views of teen driver safety and smartphones’ role in distracting driving. Now, let’s look at how parental views on these topics differ by geography. As you would expect, the survey uncovered major differences between U.S. regions
Common Driving Distractions for Teens
Q: In your opinion, which of the following distracted driving behaviors is the most dangerous for your teen driver? (n=2,005)
20.55% of the entire panel cited Smartphone Use as most dangerous, while 16.21% said Talking on the Phone was dangerous, 13.27% said Driving with friends in the car was most dangerous and 12.87% said Texting was the most dangerous distraction. Here’s how the numbers break down by U.S. region:
Northeast (n=806)
- Smartphone Use – 23.45%
- Talking on the phone – 19.73%
- Texting – 16.87%
- Driving with friends in the car – 15.01%
Southeast (n=452)
- Smartphone Use – 13.94%
- Talking on the phone – 9.51%
- Texting – 6.64%
- Driving with friends in the car – 10.84%
* Noteworthy stat: 40.27% of parents from the Southeast region selected the option ‘None of the above’
West (n=328)
- Smartphone Use – 17.99%
- Talking on the phone – 18.90%
- Texting – 16.46%
- Driving with friends in the car – 12.50%
Midwest (n=227)
- Smartphone Use – 24.67%
- Talking on the phone – 10.13%
- Texting – 9.25%
- Driving with friends in the car – 9.25%
* Noteworthy stat: 18.94% of parents from the Midwest region selected the option ‘None of the above’
Southwest (n=192)
- Smartphone Use – 23.44%
- Talking on the phone – 19.79%
- Texting – 8.85%
- Driving with friends in the car – 17.71%
Teens, Smartphones & Distracted Driving
To what extent do you agree or disagree with the following statement?
Q: My child’s generation is more at risk for distracted driving & distracted-driving related accidents than any generation before because of smartphones. (n=2,005)
39.10% of the entire panel selected ‘Strongly agree’, while another 30.47% selected ‘Somewhat agree’. Just 10.87% of parents surveyed selected ‘Strongly disagree’. Here’s how the numbers break down by U.S. region:
Northeast (n=806)
- Strongly agree – 46.90%
- Somewhat agree – 31.89%
- Neither agree nor disagree – 16.75%
- Somewhat disagree – 1.36%
- Strongly disagree – 3.10%
Southeast (n=452)
- Strongly agree – 26.33%
- Somewhat agree – 23.01%
- Neither agree nor disagree – 17.26%
- Somewhat disagree – 1.99%
- Strongly disagree – 31.42%
* Noteworthy stat: Of the 218 parents that answered ‘Strongly disagree’, 142 or 65.13% hailed from the Southeastern U.S.
West (n=328)
- Strongly agree – 39.33%
- Somewhat agree – 31.71%
- Neither agree nor disagree – 14.94%
- Somewhat disagree – 7.01%
- Strongly disagree – 7.01%
Midwest (n=227)
- Strongly agree – 31.28%
- Somewhat agree – 36.12%
- Neither agree nor disagree – 14.54%
- Somewhat disagree – 11.01%
- Strongly disagree – 7.05%
Southwest (n=192)
- Strongly agree – 45.31%
- Somewhat agree – 33.33%
- Neither agree nor disagree – 12.50%
- Somewhat disagree – 2.60%
- Strongly disagree – 6.25%
Driver Safety Monitoring Technology
Q: How much would you be willing to pay on a monthly basis for a mobile app that monitors your teen’s driving behaviors, provides trip detail information, personalized driver scores, and automatic collision notifications? (n=1,657)
30.05% of the parents that answered this question selected ‘$14.99/month’, while 20.34% selected ‘$19.99/month’ and another 20.34% selected ‘$9.99/month’. Just 1.57% of parents that answered this question selected ‘I would not pay a monthly subscription fee for this type of app.’ Here’s how the numbers break down by U.S. region:
Northeast (n=806) ++
- $29.99/month (includes active monitoring and live support) – 4.34%
- $24.99/month – 6.82%
- $19.99/month – 15.01%
- $14.99/month – 29.28%
- $9.99/month – 19.85%
- Less than $9.99/month – 14.27%
- I would not pay a monthly subscription fee for this type of app – 0.99%
* Noteworthy stat: Less than 1 in 10 parents (9.43%) from the Northeastern region said they wouldn’t use this type of mobile app.
Southeast (n=452)
- $29.99/month (includes active monitoring and live support) – 3.54%
- $24.99/month – 7.08%
- $19.99/month – 16.37%
- $14.99/month – 16.15%
- $9.99/month – 11.73%
- Less than $9.99/month – 5.97%
- I would not pay a monthly subscription fee for this type of app – 1.33%
* Noteworthy stat: Nearly 38% of parents from the Southeastern region said they wouldn’t use this type of mobile app.
West (n=328)
- $29.99/month (includes active monitoring and live support) – 3.66%
- $24.99/month – 13.72%
- $19.99/month – 20.12%
- $14.99/month – 23.78%
- $9.99/month – 14.63%
- Less than $9.99/month – 7.32%
- I would not pay a monthly subscription fee for this type of app – 1.22%
* Noteworthy stat: About 1 out of 7 parents (15.55%) from the West region said they wouldn’t use this type of mobile app.
Midwest (n=227)
- $29.99/month (includes active monitoring and live support) – 9.69%
- $24.99/month – 9.25%
- $19.99/month – 14.98%
- $14.99/month – 23.79%
- $9.99/month – 15.42%
- Less than $9.99/month – 7.05%
- I would not pay a monthly subscription fee for this type of app – 2.64%
* Noteworthy stat: About 1 out of 6 parents (17.50%) from the West region said they wouldn’t use this type of mobile app.
Southwest
- $29.99/month (includes active monitoring and live support) – 4.17%
- $24.99/month – 9.38%
- $19.99/month – 21.88%
- $14.99/month – 26.69%
- $9.99/month – 21.35%
- Less than $9.99/month – 6.77%
- I would not pay a monthly subscription fee for this type of app – 1.04%
* Noteworthy stat: Less than 6% of parents from the Southwestern region said they wouldn’t use this type of mobile app.
Key Takeaways based on U.S. Region
- Based on our survey data, parents located in the Northeast and Southwest are more likely to view smartphone-related distracted driving as a source of danger for their teen driver(s). These parents are also more likely to use and pay a monthly subscription fee for a mobile app that provides driver safety monitoring functionality.
- The majority of parents in the Southeast (and to a lesser extent the Midwest) do not view smartphone-related distracted driving as a major safety concern for their teen driver(s). Not surprisingly, parents from these regions were much less likely to say they would use/pay for a mobile app that provides driver safety monitoring functionality.
- More than eight in 10 of parents surveyed (82.64%) said they would use a mobile app that provides driver safety monitoring functionality. More than 98% of 1,657 parents that said they would use this type of app also said they would be willing to pay a monthly subscription fee for it.
- Nearly half (49.13%) of the 348 parents that said they would not use this type of app hail from the Southeastern U.S. This subset (171 parents) comprises more than a third (37.83%) of the total surveyed from the Southeast (452).
Distracted Driving Survey eBook
** To learn more about the methodology of the survey or to download the survey overview eBook, visit https://info.smithmicro.com/teen-driver-safety-survey
++ Percentages for the regional splits in this section refer to the amount of parents that selected a certain option out of the regional total surveyed. (see map at top of post for further clarification)